Free Budget Payroll Report
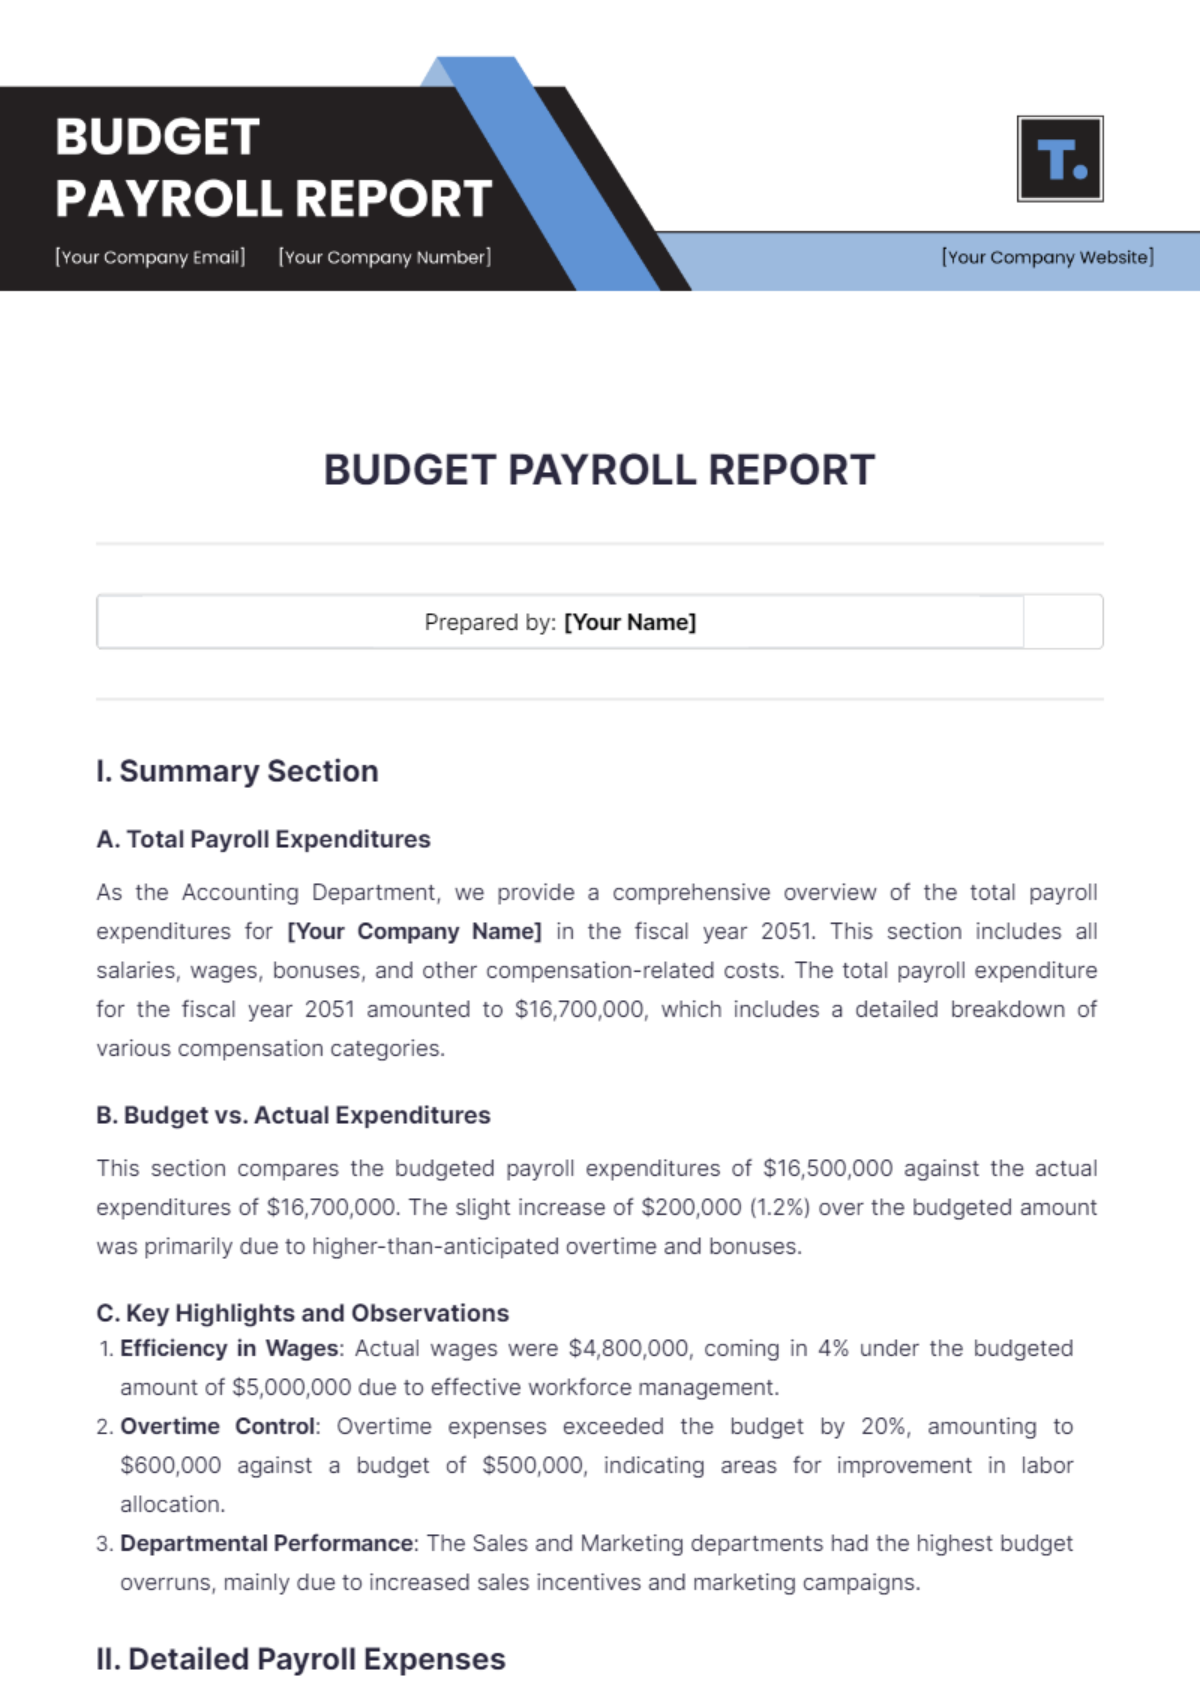
Prepared by: [Your Name] |
I. Summary Section
A. Total Payroll Expenditures
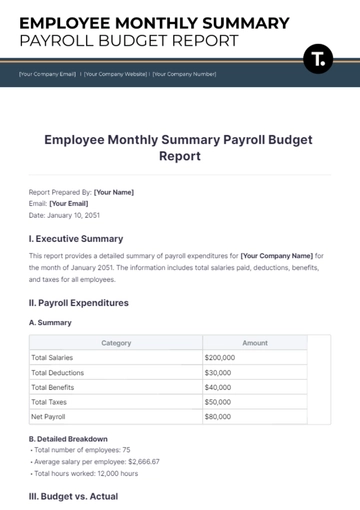
As the Accounting Department, we provide a comprehensive overview of the total payroll expenditures for [Your Company Name] in the fiscal year 2051. This section includes all salaries, wages, bonuses, and other compensation-related costs. The total payroll expenditure for the fiscal year 2051 amounted to $16,700,000, which includes a detailed breakdown of various compensation categories.
B. Budget vs. Actual Expenditures
This section compares the budgeted payroll expenditures of $16,500,000 against the actual expenditures of $16,700,000. The slight increase of $200,000 (1.2%) over the budgeted amount was primarily due to higher-than-anticipated overtime and bonuses.
C. Key Highlights and Observations
Efficiency in Wages: Actual wages were $4,800,000, coming in 4% under the budgeted amount of $5,000,000 due to effective workforce management.
Overtime Control: Overtime expenses exceeded the budget by 20%, amounting to $600,000 against a budget of $500,000, indicating areas for improvement in labor allocation.
Departmental Performance: The Sales and Marketing departments had the highest budget overruns, mainly due to increased sales incentives and marketing campaigns.
II. Detailed Payroll Expenses
Category | Budgeted Amount | Actual Amount | Variance | Percentage Variance |
|---|---|---|---|---|
Salaries | $10,000,000 | $10,200,000 | $200,000 | 2% |
Wages | $5,000,000 | $4,800,000 | -$200,000 | -4% |
Overtime | $500,000 | $600,000 | $100,000 | 20% |
Bonuses | $1,000,000 | $1,100,000 | $100,000 | 10% |
Total | $16,500,000 | $16,700,000 | $200,000 | 1.2% |
III. Benefits and Taxes
Category | Budgeted Amount | Actual Amount | Variance | Percentage Variance |
|---|---|---|---|---|
Health Insurance | $2,000,000 | $2,100,000 | $100,000 | 5% |
Retirement Contributions | $1,500,000 | $1,450,000 | -$50,000 | -3.3% |
Payroll Taxes | $3,000,000 | $3,100,000 | $100,000 | 3.3% |
Other Benefits | $500,000 | $550,000 | $50,000 | 10% |
Total | $7,000,000 | $7,200,000 | $200,000 | 2.9% |
IV. Departmental Breakdown
Department | Budgeted Amount | Actual Amount | Variance | Percentage Variance |
|---|---|---|---|---|
Sales | $4,000,000 | $4,200,000 | $200,000 | 5% |
Marketing | $2,500,000 | $2,600,000 | $100,000 | 4% |
Engineering | $5,000,000 | $5,050,000 | $50,000 | 1% |
HR | $1,000,000 | $950,000 | -$50,000 | -5% |
Operations | $4,000,000 | $3,900,000 | -$100,000 | -2.5% |
Total | $16,500,000 | $16,700,000 | $200,000 | 1.2% |
V. Variance Analysis
A. Positive Variances
In this subsection, we analyze the positive variances where actual expenditures were lower than the budgeted amounts, identifying reasons and potential impacts on the overall budget. For example, the HR department managed to save $50,000 (5%) from its budget by optimizing recruitment processes and reducing hiring costs.
B. Negative Variances
This subsection examines the negative variances where actual expenditures exceeded the budgeted amounts, providing explanations and potential corrective actions to manage these discrepancies in future budgets. The Marketing department exceeded its budget by $100,000 (4%) due to an unplanned promotional campaign aimed at boosting year-end sales.
C. Significant Variances
We focus on significant variances (both positive and negative), detailing their causes and recommending measures to address these variances in future financial planning. For instance, the Sales department exceeded its budget by $200,000 (5%) due to higher commission payouts driven by increased sales performance.
VI. Trends and Projections
Year | Budgeted Payroll | Actual Payroll | Projected Payroll for 2052 |
|---|---|---|---|
2048 | $15,000,000 | $15,200,000 | $16,000,000 |
2049 | $15,500,000 | $15,800,000 | $16,500,000 |
2050 | $16,000,000 | $16,500,000 | $17,000,000 |
2051 | $16,500,000 | $16,700,000 | $17,500,000 |
A. Analysis
Over the past four years, payroll expenses have shown a steady increase, reflecting both growth in headcount and incremental compensation adjustments. The projected payroll for 2052 is estimated at $17,500,000, indicating a continued upward trend. To manage this increase, we recommend proactive budget planning and cost control measures.
VII. Conclusion
The Budget Payroll Report for [Your Company Name] for the fiscal year 2051 indicates effective financial management, despite some variances between the budgeted and actual payroll expenditures. Positive variances in several areas suggest efficiency, whereas negative variances provide opportunities for improvement. The trends and projections indicate a steady increase in payroll expenses, necessitating careful planning and monitoring in future fiscal years.
- 100% Customizable, free editor
- Access 1 Million+ Templates, photo’s & graphics
- Download or share as a template
- Click and replace photos, graphics, text, backgrounds
- Resize, crop, AI write & more
- Access advanced editor
Streamline your payroll process with the Budget Payroll Report Template from Template.net. This fully customizable and editable template ensures accurate payroll management. Editable in our AI Editor Tool, it allows seamless adjustments to meet your specific needs. Save time and stay organized with this essential payroll solution.
You may also like
- Budget Sheet
- Personal Budget
- Non Profit Budget
- Monthly Budget
- Project Budget
- HR Budget
- Company Budget
- Home Budget
- Weekly Budget
- College Budget
- Business Budget
- Construction Budget
- Small Business Budget
- Hotel Budget
- Annual Budget
- Home Renovation Budget
- Household Budget
- Student Budget
- Grocery Budget
- Marketing Budget
- Corporate Budget
- Startup Budget
- Manufacturing Budget
- Church Budget
- University Budget
- Annual Budget Plan
- Event Budget
- Operating Budget
- Travel Budget
- Food Budget
- IT and Software Budget
- School Budget
- Real Estate Budget
- Sales Budget
- Conference Budget
- Budget Finance
- Freelancer Budget
- Budget Advertising
