Free Printable Non-Profit Budget
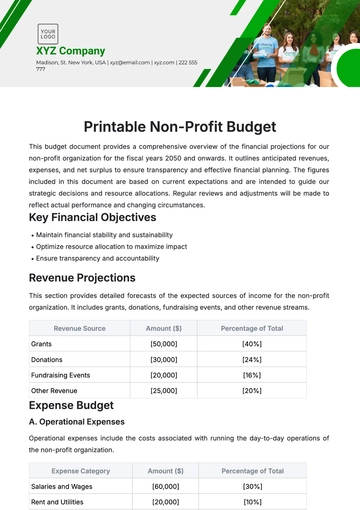
This budget document provides a comprehensive overview of the financial projections for our non-profit organization for the fiscal years 2050 and onwards. It outlines anticipated revenues, expenses, and net surplus to ensure transparency and effective financial planning. The figures included in this document are based on current expectations and are intended to guide our strategic decisions and resource allocations. Regular reviews and adjustments will be made to reflect actual performance and changing circumstances.
Key Financial Objectives
Maintain financial stability and sustainability
Optimize resource allocation to maximize impact
Ensure transparency and accountability
Revenue Projections
This section provides detailed forecasts of the expected sources of income for the non-profit organization. It includes grants, donations, fundraising events, and other revenue streams.
Revenue Source | Amount ($) | Percentage of Total |
|---|---|---|
Grants | [50,000] | [40%] |
Donations | [30,000] | [24%] |
Fundraising Events | [20,000] | [16%] |
Other Revenue | [25,000] | [20%] |
Expense Budget
A. Operational Expenses
Operational expenses include the costs associated with running the day-to-day operations of the non-profit organization.
Expense Category | Amount ($) | Percentage of Total |
|---|---|---|
Salaries and Wages | [60,000] | [30%] |
Rent and Utilities | [20,000] | [10%] |
Office Supplies | [10,000] | [5%] |
Communications | [5,000] | [2.5%] |
B. Program Expenses
Program expenses encompass the costs directly associated with delivering the non-profit organization's services and programs.
Expense Category | Amount ($) | Percentage of Total |
|---|---|---|
Program Staff | [40,000] | [20%] |
Program Supplies | [20,000] | [10%] |
Participant Costs | [10,000] | [5%] |
Transportation | [5,000] | [2.5%] |
C. Administrative Costs
Administrative costs refer to the expenses related to the overall management and general administration of the organization.
Expense Category | Amount ($) | Percentage of Total |
|---|---|---|
Board Expenses | [5,000] | [2.5%] |
Professional Services | [10,000] | [5%] |
Insurance | [5,000] | [2.5%] |
Miscellaneous | [2,500] | [1.25%] |
Summary and Analysis
A. Revenue vs. Expenses
The total projected revenue for the fiscal year is [$125,000], while the total budgeted expenses amount to [$137,500]. This results in a budget deficit of [$12,500]. The organization should explore additional funding opportunities or cost-saving measures to address this shortfall.
B. Financial Risks
Some potential financial risks include:
Uncertainty in grant funding
Volatility in donation levels
Unexpected increases in operational costs
C. Performance Metrics
Key financial performance metrics to monitor include:
Revenue growth rate
Expense ratio
Operating margin
By carefully analyzing these metrics, the organization can make informed decisions to enhance its financial health and ensure long-term sustainability.
- 100% Customizable, free editor
- Access 1 Million+ Templates, photo’s & graphics
- Download or share as a template
- Click and replace photos, graphics, text, backgrounds
- Resize, crop, AI write & more
- Access advanced editor
Manage your finances with the Printable Non-Profit Budget Template from Template.net. This editable and customizable template helps you create a detailed budget. Print and adjust it easily using our Ai Editor Tool to fit your non-profit’s financial planning needs. Take control of your budget—design and manage with our printable template!
You may also like
- Budget Sheet
- Personal Budget
- Non Profit Budget
- Monthly Budget
- Project Budget
- HR Budget
- Company Budget
- Home Budget
- Weekly Budget
- College Budget
- Business Budget
- Construction Budget
- Small Business Budget
- Hotel Budget
- Annual Budget
- Home Renovation Budget
- Household Budget
- Student Budget
- Grocery Budget
- Marketing Budget
- Corporate Budget
- Startup Budget
- Manufacturing Budget
- Church Budget
- University Budget
- Annual Budget Plan
- Event Budget
- Operating Budget
- Travel Budget
- Food Budget
- IT and Software Budget
- School Budget
- Real Estate Budget
- Sales Budget
- Conference Budget
- Budget Finance
- Freelancer Budget
- Budget Advertising
