Free Business Budget
I. Introduction
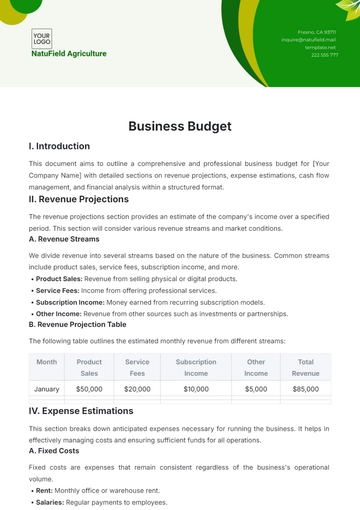
This document aims to outline a comprehensive and professional business budget for [Your Company Name] with detailed sections on revenue projections, expense estimations, cash flow management, and financial analysis within a structured format.
II. Revenue Projections
The revenue projections section provides an estimate of the company's income over a specified period. This section will consider various revenue streams and market conditions.
A. Revenue Streams
We divide revenue into several streams based on the nature of the business. Common streams include product sales, service fees, subscription income, and more.
Product Sales: Revenue from selling physical or digital products.
Service Fees: Income from offering professional services.
Subscription Income: Money earned from recurring subscription models.
Other Income: Revenue from other sources such as investments or partnerships.
B. Revenue Projection Table
The following table outlines the estimated monthly revenue from different streams:
Month | Product Sales | Service Fees | Subscription Income | Other Income | Total Revenue |
|---|---|---|---|---|---|
January | $50,000 | $20,000 | $10,000 | $5,000 | $85,000 |
IV. Expense Estimations
This section breaks down anticipated expenses necessary for running the business. It helps in effectively managing costs and ensuring sufficient funds for all operations.
A. Fixed Costs
Fixed costs are expenses that remain consistent regardless of the business's operational volume.
Rent: Monthly office or warehouse rent.
Salaries: Regular payments to employees.
Utilities: Utilities such as electricity, water, and internet.
Insurance: Health, property, and liability insurance.
B. Variable Costs
Variable costs fluctuate depending on the level of production and sales.
Raw Materials: Cost of materials required to produce goods.
Marketing: Expenditures on advertising and promotions.
Shipping: Costs associated with delivering products to customers.
Commissions: Payments to sales agents.
C. Expense Estimation Table
The table below specifies both fixed and variable costs on a monthly basis:
Month | Rent | Salaries | Utilities | Insurance | Raw Materials | Marketing | Shipping | Commissions |
|---|---|---|---|---|---|---|---|---|
January | $5,000 | $30,000 | $2,000 | $1,000 | $15,000 | $5,000 | $1,500 | $500 |
Total Expenses: $185,000
V. Cash Flow Management
Cash flow management is critical for ensuring that the business has enough liquidity to meet its obligations. The difference between inflows (revenue) and outflows (expenses) determines the net cash flow.
A. Monitoring Cash Flow
Effective monitoring involves regularly reviewing financial statements, tracking cash positions, and forecasting future cash needs.
Review Financial Statements: Regular analysis of income statements and balance sheets.
Track Cash Positions: Keeping a close eye on bank account balances.
Forecasting: Predicting future cash needs to avoid potential shortfalls.
B. Cash Flow Table
The table below presents the monthly cash flow, illustrating net cash flow by subtracting total expenses from total revenues:
Month | Total Revenue | Total Expenses | Net Cash Flow |
|---|---|---|---|
January | $85,000 | $60,000 | $25,000 |
VI. Financial Analysis
Financial analysis involves interpreting the data from the revenue projections, expense estimations, and cash flow management to provide insights into the company's financial performance.
A. Profit and Loss Analysis
This analysis helps in understanding the overall profitability of the business by comparing total revenue against total expenses over a given period.
Key Metrics to Consider:
Gross Profit: Total revenue minus the cost of goods sold (COGS).
Operating Profit: Gross profit minus operating expenses.
Net Profit: Operating profit minus taxes and other non-operating costs.
B. Break-Even Analysis
A break-even analysis helps determine the sales volume at which total revenue equals total expenses, indicating no profit or loss.
Formula:
Break-Even Point = Fixed Costs / (Unit Selling Price - Variable Costs per Unit) |
|---|
C. Financial Analysis Table
The following table summarizes the key financial indicators based on the data provided:
Month | Gross Profit | Operating Profit | Net Profit | Break-Even Point (Units) |
|---|---|---|---|---|
January | $70,000 | $40,000 | $30,000 | 500 |
VII. Conclusion
A well-structured business budget encompasses detailed revenue projections, accurate expense estimations, careful cash flow management, and thorough financial analysis. This comprehensive approach enables businesses to achieve better financial control, make informed decisions, and foster long-term growth and sustainability.
- 100% Customizable, free editor
- Access 1 Million+ Templates, photo’s & graphics
- Download or share as a template
- Click and replace photos, graphics, text, backgrounds
- Resize, crop, AI write & more
- Access advanced editor
Manage your finances effectively with the Business Budget Template from Template.net. This editable and customizable document provides a structured framework for planning and tracking your income, expenses, and financial goals. Fully editable in our Ai Editor Tool, it allows you to tailor the budget to fit your business's specific needs, ensuring better financial oversight and informed decision-making.
You may also like
- Budget Sheet
- Personal Budget
- Non Profit Budget
- Monthly Budget
- Project Budget
- HR Budget
- Company Budget
- Home Budget
- Weekly Budget
- College Budget
- Business Budget
- Construction Budget
- Small Business Budget
- Hotel Budget
- Annual Budget
- Home Renovation Budget
- Household Budget
- Student Budget
- Grocery Budget
- Marketing Budget
- Corporate Budget
- Startup Budget
- Manufacturing Budget
- Church Budget
- University Budget
- Annual Budget Plan
- Event Budget
- Operating Budget
- Travel Budget
- Food Budget
- IT and Software Budget
- School Budget
- Real Estate Budget
- Sales Budget
- Conference Budget
- Budget Finance
- Freelancer Budget
- Budget Advertising
